History of Achievement

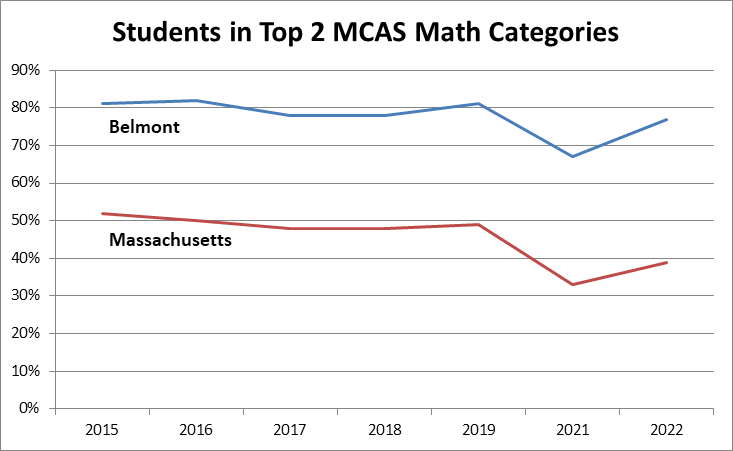
Belmont has a long history of supporting students in achievement of excellence in math outcomes. Our students have historically far outperformed state expectations. In 2022, 77% of Belmont students met or exceeded state math expectations vs. 39% statewide. We absolutely need to meet every student where they are and provide structures for challenge and support.

Belmont Students Far Outperform State Expectations

The majority of Belmont students consistently score in the top 2 categories of the annual Massachusetts assessment exam (see Figure 1). Typically about 80% of all Belmont students in grades 3-8 score in these 2 MCAS categories, compared to about 50% of students statewide. 

The pandemic years led to drops in MCAS scores across Massachusetts.  Despite the pandemic, Belmont students continued to significantly outperform the state. In 2022, 77% of Belmont students 3-8 scored in the top 2 categories, compared to just 39% of all Massachusetts students.   At the same time, a record-high 73.1% of Belmont 8th graders were  taking Algebra 1, with nearly half of them also taking Challenger Geometry,  clearly showing the growing need for more in-school math options.

Grades
Figure 1: Percent of All Grade 3-8 Students in Top 2 MCAS/PARCC Categories

Far Fewer Belmont Students Are Not Meeting Expectations than in Massachusetts as a Whole

Figure 2 shows the percent of all students in grades 3-8 scoring in the lowest 2 MCAS categories, “Partially Meeting Expectations” and “Not Meeting Expectations.” Around 20% of all Belmont students (about 400-490 students each year from 2017-19) in grades 3-8 are typically in these categories for math, with 17-19% (about 360-420 students per year) typically categorized as “partially meeting expectations” and 2-3% (about 40-70 students) as “not meeting expectations.”  Across MA, a much larger percentage (about 50%) of all students are typically in these categories, 39-41% in “partially meeting expectations” and 12% “not meeting expectations.”

In 2021 the number of students partially or not meeting expectations increased to 67% of all MA students, an increase from 51% in 2019.  Similarly, the Belmont number increased to 33% of students (about 590 partially meeting expectations and 100 not meeting expectations), an increase from 19% in 2019.

Given the long-term stability of the Belmont MCAS results, scores can be expected to return to normal pre-pandemic levels. In 2022 scores were already higher than in 2021, both in Belmont and in Massachusetts as a whole.

Grades 3-8, Students Partially or Not Meeting Expectations, Belmont vs. Massachusetts 2017-2022
Figure 2: Percent of All Grade 3-8 Students in Lowest 2 MCAS Categories

Belmont Students’ Scores Skew Much Higher than the State Average

Zooming in on a typical Chenery grade, Figure 3 shows the 2022 MCAS math results for Belmont 6th graders, who are 7th graders at Chenery in 2022-23.  This graph shows the distribution of raw scores for Belmont 6th grade students vs. the scaled distribution of scores for all Massachusetts 6th grade students.

These charts are useful to identify that there are many BPS students scoring most questions correct on the MCAS, that their learning needs are significantly different than those scoring around the median number correct, and extremely different from those students scoring very few of the grade-level questions correctly.

2022 Grade 6 Belmont vs Massachusetts
Figure 3: Distribution of 2022 MCAS Math Raw Scores for All 6th Graders in Belmont and Massachusetts